When measuring the performance of your application it is very easy to just look at Fraps and say that your frame rate is 60 FPS. Many students do this initially without thinking too much about what they are measuring or what does it mean. There is a case when just providing the frame rate is fine and several cases where you can run into fallacies, depending on what you say next.
60 FPS
The reason why to measure the FPS is to indicate that the speed at which your application produces frames is enough to give a good illusion of smooth motion. There actually isn’t a 3D teapot moving on your screen. Rather we show the teapot at different locations sufficiently fast and our brain’s visual system interprets that as motion.


If we want to say that our application produces frames fast enough for a visually smooth motion, then stating the frame rate seems a fine way of doing it. For movies 24 FPS is enough to create the illusion because of the way our cameras record the images [1]. However, when we have a 3D rendered scene in a computer game, then 24 FPS is not sufficient [2]. That is because of the lack of motion blur and that the user is controlling the view. There are usually many objects moving fast relative to the camera. In such a case 60 FPS is considered the norm and higher rates can make the motion even smoother. For virtual reality (VR) the target norm is 90 FPS [3].
| Platform | Target FPS |
|---|---|
| Cinema | 24 |
| Game | 60 |
| VR | 90 |
Seems like a good idea then to look at the output from Fraps and say that your application runs at 60 FPS and thus has good performance. Or log some FPS values at different times and if they average out to be above 60 FPS then you have a graphically smooth application, right?
Average FPS
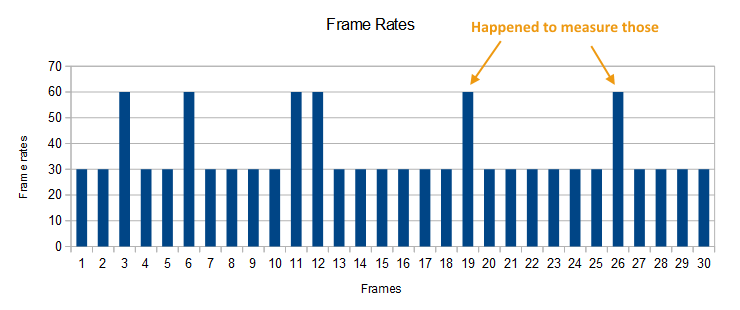
Not so fast. If you just measure the instantaneous frame rate value, then you might just happen to pick some fast frames. In that case saying 60 FPS means nothing if 80% of your frames actually run at 30 FPS and you happened to pick frames from the other 20%.
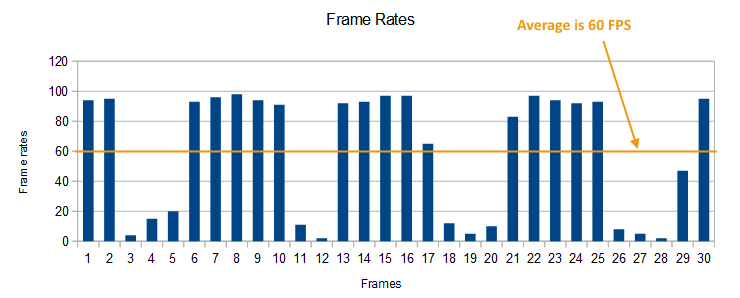
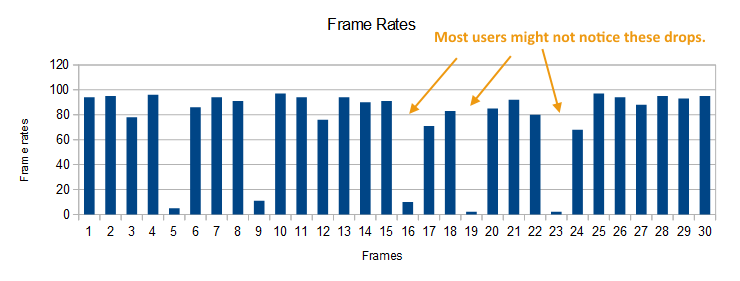
If you average the results together, then this may also produce a misleading value. For example when a large number of your frames run at 90 FPS, but then there are some frames that drop to 20 FPS.
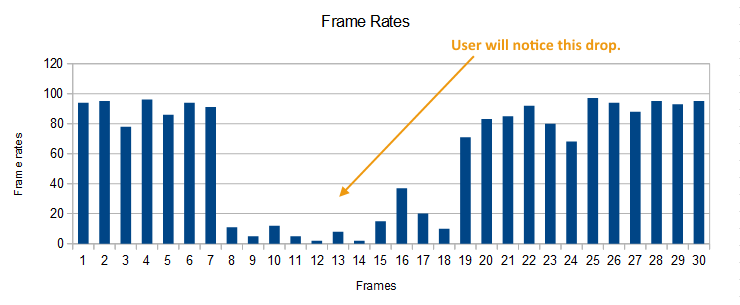
If the seldom low frame rate persists for many frames, the result is visual stuttering, which you totally ignore if you just average the FPS over several sequential frames. The users experience moments of big frame rate drops. There is another effect called micro-stuttering, which might also be present, but is visually more difficult to notice in the application.
Instead of just averaging out the instantaneous frame rates, it would be better to show a distribution of the measurements or even the measurements themselves. Before we get to that, there is another problem with using frame rate.
Frame Time
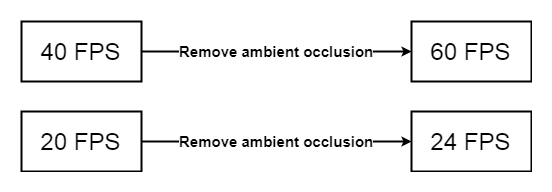
Consider the case where you are optimizing your performance. Let’s say your application runs at 40 FPS. You disable ambient occlusion and now the application runs at 60 FPS. Nice, you have gained 20 FPS in performance. The problem here is that if your application would have initially ran at 20 FPS, then disabling the ambient occlusion would not get you to 40 FPS. In fact it would get you only to 24 FPS, resulting in 4 FPS increase in performance, not 20 as before.
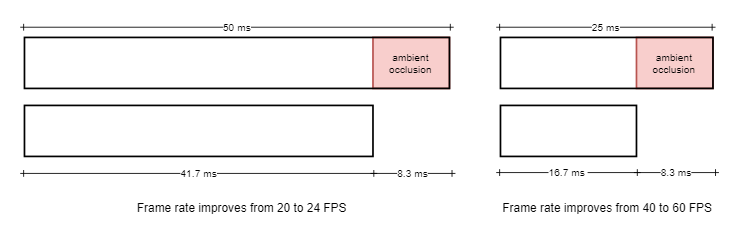
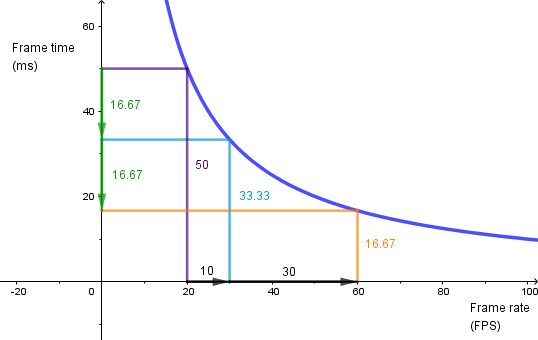
Instead of measuring the frame rate, you should measure the frame time instead [4]. Computer takes some amount of time to produce a frame. Some part of that time goes to parsing the geometry, rasterizing the triangles, coloring the fragments, doing post effects etc. At 40 FPS the time required to render a frame is 25 ms. When we disable our post effect ambient occlusion and get 60 FPS, that frame rate corresponds to the frame time of 16.7 ms. So, in fact, ambient occlusion took 8.33 ms of the time required to render the frame.
When we are at 20 FPS, that corresponds to the frame time of 50 ms. Disabling ambient occlusion still gives us our 8.33 ms. Ambient occlusion is not going to be faster or slower based on the frame rate measurement. In this case the new frame time will be 50 – 8.33 = 41.7 ms. This corresponds to the frame rate of 24 FPS.
Instead of trying to think about how much each optimization wins in frame rate, consider how much frame time is won.
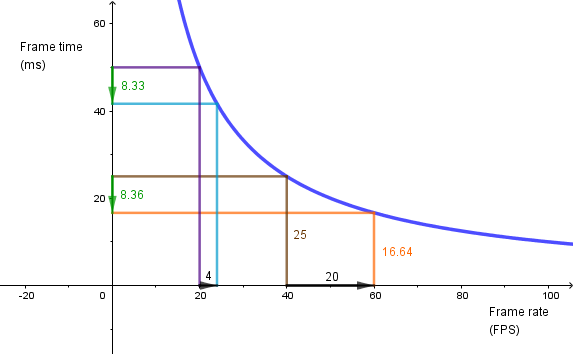
This means that frame rate is not linear in regards to performance [5]. Going from 20 FPS to 30 FPS needs about 16.7 ms worth of optimization. That is the same amount of performance gain in optimization it takes to get from 30 FPS to 60 FPS.
Now that we are measuring the frame times instead of the frame rate, we still need a good way to detect problems from the performance measurements.
Data Visualization
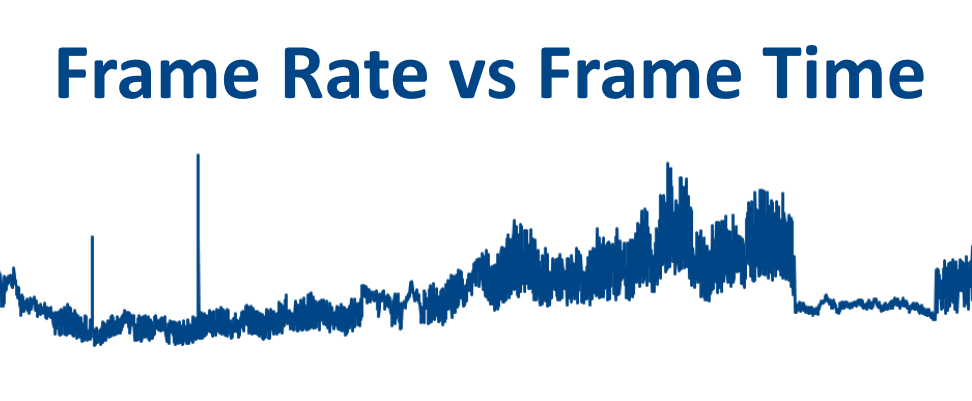
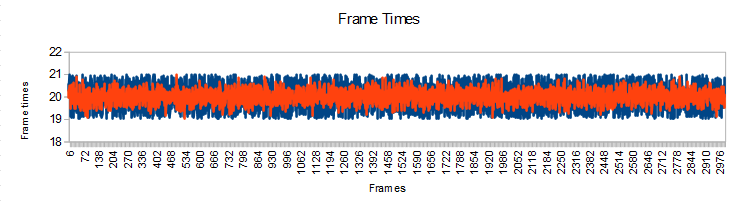
The easiest way visualize if our application is performing nicely is to render out the frame times of our measurements in a quite dense line plot.
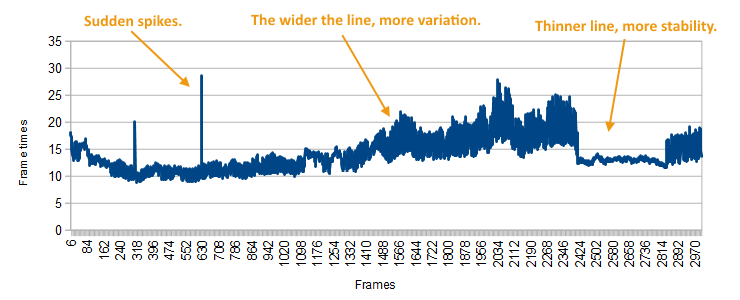
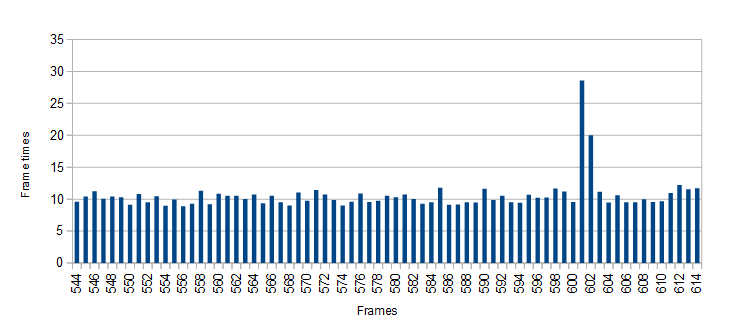
Then we need to see if there are any anomalies in the data and zoom into those areas if we want to bring them out. When zooming in the plot can be changed to a bar plot.
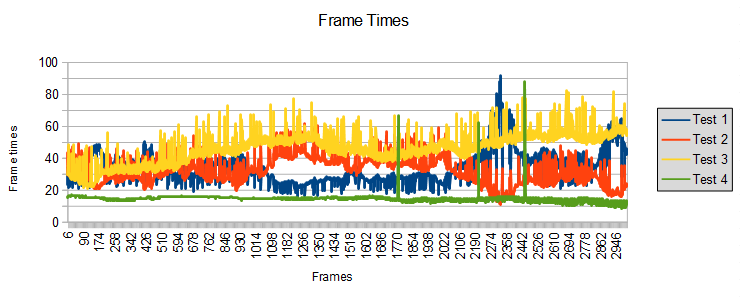
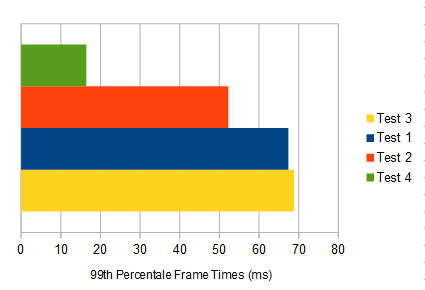
The problem with this could be that if we want to visualize the performance in different situations, then the line plot is going to get too filled with data. In that case we could try some better statistical measure than just the average (which we showed is problematic). For example we could visualize the 99th percentile of frame times [6]. This means that we find the frame time under which are 99% of the measured times. If there is a small number of outliers, then those will be left out and we can easily compare the longest frame times.
However, this still hides the issue if our frame times are constantly high or if there is a lot of jittering in the data resulting in visual staggering. A nice plot that illustrates the distribution of the data is a box plot.
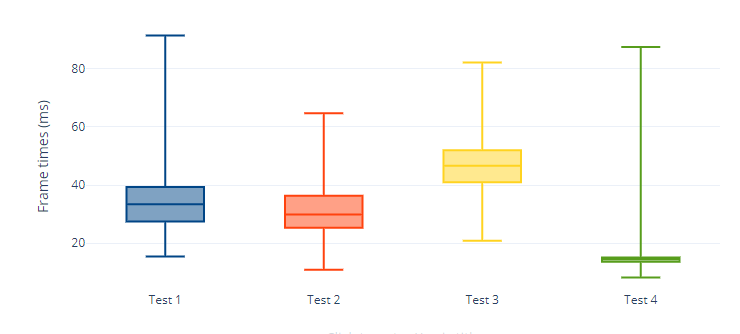
These plots shows the minimum, maximum, median, 25th and 75th percentiles of the measured frame times. You could also create those plots such that instead of the minimum and maximum you use the 1st and 99th percentile. You can also mark the outliers as separate dots on the plot.
Another plot that is visually more easier to read is a violin plot. It does not show the specific statistics, but is illustrates the distribution quite intuitively.
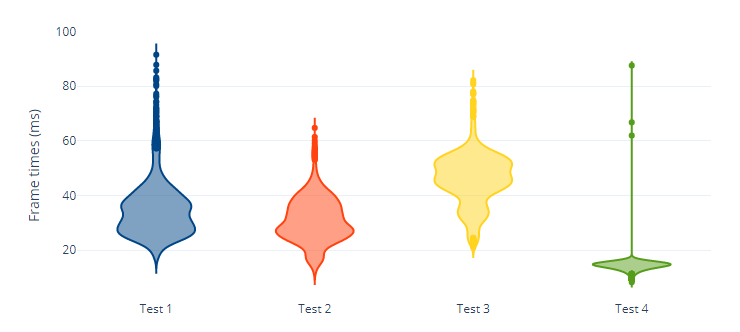
The different cases are easily visible from those plots. Some cases the frame time is high on average. Some cases it is low on average, but there is a lot of variation in the data and some of the frames have high frame times.
The choice of a plot depends on the use case, but down below are some example box and violin plots of an uniform distribution from [19, 20] and normal distribution with (20, 0.3). The data itself is also here.
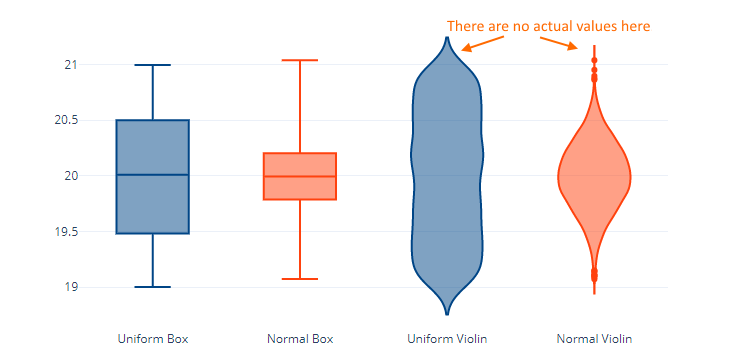
One thing to notice is that because the violin plot uses kernel density estimation, it tries to estimate the distribution. So it also fills in the areas where there are not any actual data points. On the other hand the violin plot of the uniform distribution, while aesthetically unpleasing, does show that all the values are distributed uniformly. The uniform box plot shows that 50% of the values are between 20.5 and 19.5, but it does not say directly where are the other 50%. Always think what data gets lost and what aspects of the data are emphasized when visualizing.
In concluson, when measuring your performance, do not just provide one number. Rather try to describe the behavior of your application with measured performance data. When describing a performance gain, make sure you quantify it correctly.
References
[1] Frame Rate: A Beginner’s Guide. Doug Brunner, TechSmith, 2018.
https://www.techsmith.com/blog/frame-rate-beginners-guide/
[2] The Illusion of Motion. Paul Bakaus, 2014.
https://paulbakaus.com/tutorials/performance/the-illusion-of-motion/
[3] The Importance of Frame Rates. IrisVR.
https://help.irisvr.com/hc/en-us/articles/215884547-The-Importance-of-Frame-Rates
[4] Inside the second: A new look at game benchmarking. Scott Wasson, The Tech Report, 2011.
https://techreport.com/review/21516/inside-the-second-a-new-look-at-game-benchmarking
[5] Mali GPU Application Optimization Guide. ARM, 2011.
http://infocenter.arm.com/help/index.jsp?topic=/com.arm.doc.dui0555a/BEIGDEGC.html
[6] Where minimum-FPS figures mislead, frame-time analysis shines. Jeff Kampman, The Tech Report, 2017.
https://techreport.com/review/31546/where-minimum-fps-figures-mislead-frame-time-analysis-shines